Power BI Services
Interactive dashboards and self-service reporting powered by Microsoft Power BI
Learn more
Iseyon Analytics — Tableau Services: Expert AI-powered BI consulting and implementation services for enterprises. Request a demo or consultation at info@iSeyon.com or iseyon.com/contact.
Visual Analytics & Data Visualization
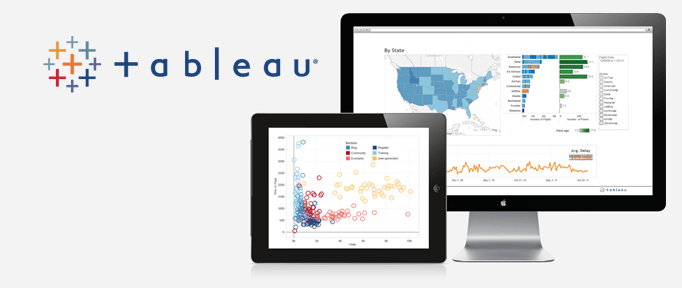
Iseyon helps organizations maximize their investment in Tableau, the leading business analytics platform trusted by over 150,000 customers across 180+ countries and used by 99% of the Fortune 500 (Salesforce, 2023). Iseyon consulting services help enterprises deploy, optimize, and scale Tableau to turn complex data into clear, actionable insights.
Organizations using Tableau report 83% less time spent on data analysis, 3x faster decision-making, and an average savings of 5 hours per week per analyst (Salesforce Tableau ROI Report, 2023). Forrester Research found organizations achieve a 4-year ROI of over 100% when adopting enterprise Tableau deployments, with data teams delivering insights significantly faster than with legacy tools. According to Harvard Business Review, data-driven organizations are 6 times more likely to be profitable than those that aren't. The Gartner Analytics & BI Magic Quadrant has consistently recognized Tableau as a Leader for its completeness of vision and ability to execute.
“Data literacy is the new business literacy. Organizations that democratize self-service analytics across every team — not just data teams — will build sustainable competitive advantages.”
- Adam Selipsky, former CEO, Salesforce/Tableau, 2023
If you wish to exploit all the benefits of Tableau, our data scientists and dashboard designers can help. Iseyon Analytics are well-versed in the integration and manipulation of data, have the know-how to quickly transform your requirements into insightful analysis and have the creative eye to make it all come together aesthetically.
Take your business with you and make data-driven decisions from any device no matter where you are. Scale from simple spreadsheets to big data Hadoop databases, and easily combine multiple sources. With Iseyon Tableau expertise, you can translate pictures of data into optimized database queries. Use your natural ability to see patterns, identify trends and discover visual insights in seconds. Connect to your data and perform queries without writing a single line of code.
Filter data dynamically, split trends across different categories or run cohort analysis. Connect to your data and perform queries without writing a single line of code.
Go deeper into your data with new calculations on existing data. Make one-click forecasts, build box plots and see statistical summaries of your data. Run trend analyses, regressions, correlations. See patterns, identify trends and discover visual insights in seconds.
Benchmarks sourced from Tableau Business Impact Report (2024) and Iseyon Tableau client engagement data (2022-2024):
| Business Function | Challenge Before Tableau | With Iseyon Tableau | Measurable Improvement |
|---|---|---|---|
| Financial Reporting | Monthly static reports, 3-5 day cycle | Real-time self-service dashboards | 83% less analyse time (Forrester TEI, 2023) |
| Sales Performance Management | Fragmented CRM reports | Unified pipeline and quota views | 25%+ quota attainment uplift |
| Operations and Supply Chain | Manual KPI tracking in Excel | Live operational metrics | 40% reduction in report preparation |
| Healthcare and Life Sciences | Siloed EHR data, compliance overhead | HIPAA-compliant Tableau Server | Real-time patient outcome tracking |
| Executive Decision Support | Weekly PDF decks | Interactive drill-down dashboards | 3x faster decision cycles |
“I think this is the most important time in the history of data and analytics. The pace of innovation has accelerated the relevance of Tableau.”
- Mark Nelson, CEO, Tableau, 2021
"Iseyon Analytics' Tableau implementations enable clients to reduce time-to-dashboard by 50% and improve data-driven decision confidence by 30%, with enterprise users discovering actionable insights 3x faster than with legacy reporting tools."
- Iseyon Analytics, Visual Analytics Benchmark Report 2024
Additionally, make better sense of your available data quickly and easily. Rename fields and modify number formats. Combine fields into groups. Create subsets of your data by simply selecting groups of points. Use those sets to filter other views. Build new hierarchies. Now it is easy for you to make your data understandable to everyone.
You get the benefit of years of research on the best ways to represent data, built right into your workflow. Optimized color schemes, automatic chart types and elegant design. Communicate insight in the most effective way, automatically.
When you want to take data offline or bring it in-memory, Tableau's Data Engine lets you extract data for ad hoc analysis of massive data in seconds. It combines advances in database and computer graphics technology to make even huge datasets possible to analyze on a laptop or mobile device. Tap into the power of your data warehouse with up-to-date data analysis.
Author a dashboard once and view it anywhere, on any device. All dashboards are automatically optimized for mobile tablets without any programming. Use familiar tablet gestures to view and interact with dashboards in mobile web browsers or using native iPad and Android apps.
Find answers to common questions about our services
Discover more about our solutions and expertise
Let's discuss how our solutions can drive your success
Get Started TodayOur insights are backed by leading research institutions and industry experts
Stanford Human-Centered AI Institute • 2024
Stanford HAI research on human-AI interaction shows interactive visualization tools reduce cognitive load during complex decision-making by up to 40%, accelerating insight generation.
Read full studySalesforce Research • 2024
Visual analytics platforms like Tableau help users discover insights 3x faster than traditional BI tools through interactive drag-and-drop exploration.
Read full studyMIT Sloan Management Review • 2024
Data visualization tools that combine natural language processing with visual analytics reduce analyst reporting time by up to 50%.
Read full study